Aero Tested - The Project 0.2 Ecosystem
12th Jan 2024
Project 0.2 started with the quest to deliver the most aerodynamically efficient time trial positions, without compromise to comfort. The Project 0.2 name refers to the benchmark CdA value (0.2 m^2) for a high-quality time trial position and our desire to achieve functional positions that exceed this drag value.
The Underlying Mechanism
To understand how the Project 0.2 ecosystem improves performance, first it is important to understand the mechanism behind those performance gains. When riding a bicycle at relevant race speeds, more than 90% of resistance to forward motion is in the form of aerodynamic drag (Lukes, et al, 2005). Approximately 70% of the aerodynamic drag is attributed to airflow over the athlete (Lukes, et al, 2005). Simply put, changes to an athlete’s position yield the greatest potential for improved aerodynamic performance.
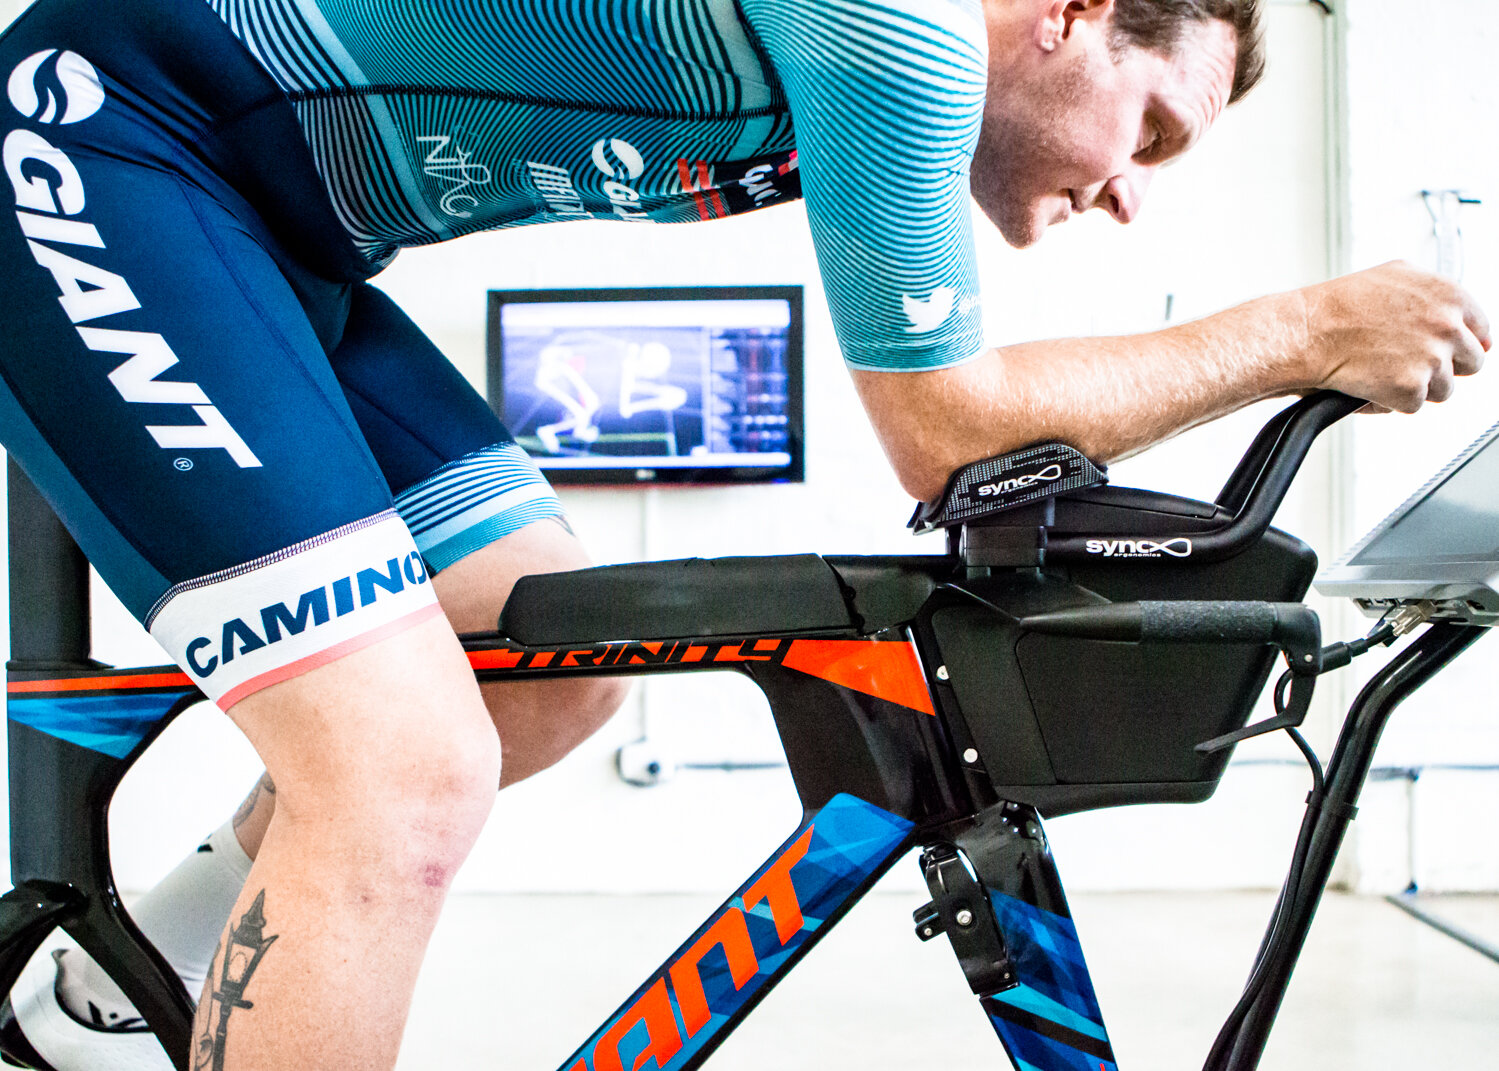
Over the past three years in the delivery of position optimisation services at Adaptive Human Performance, it’s this thought process that has evolved into the development of Sync Ergonomics. We develop our knowledge using lab-based biomechanical analysis technology (STT Systems) to understand the kinematics of the most effective time trial positions and validated our positional outcomes using field-based aero analysis methods (Alphamantis Technologies). We know for sure, with every time trial performer we’ve worked with at Adaptive HP, that the high-hands position improves comfort and improves aerodynamic efficiency. For us, it’s not a question of trying it, it’s a question of how to successfully execute the high-hands position.
“Uncompromised support for the high-hands position. Improving aerodynamic performance through improved position quality”
Aero Testing
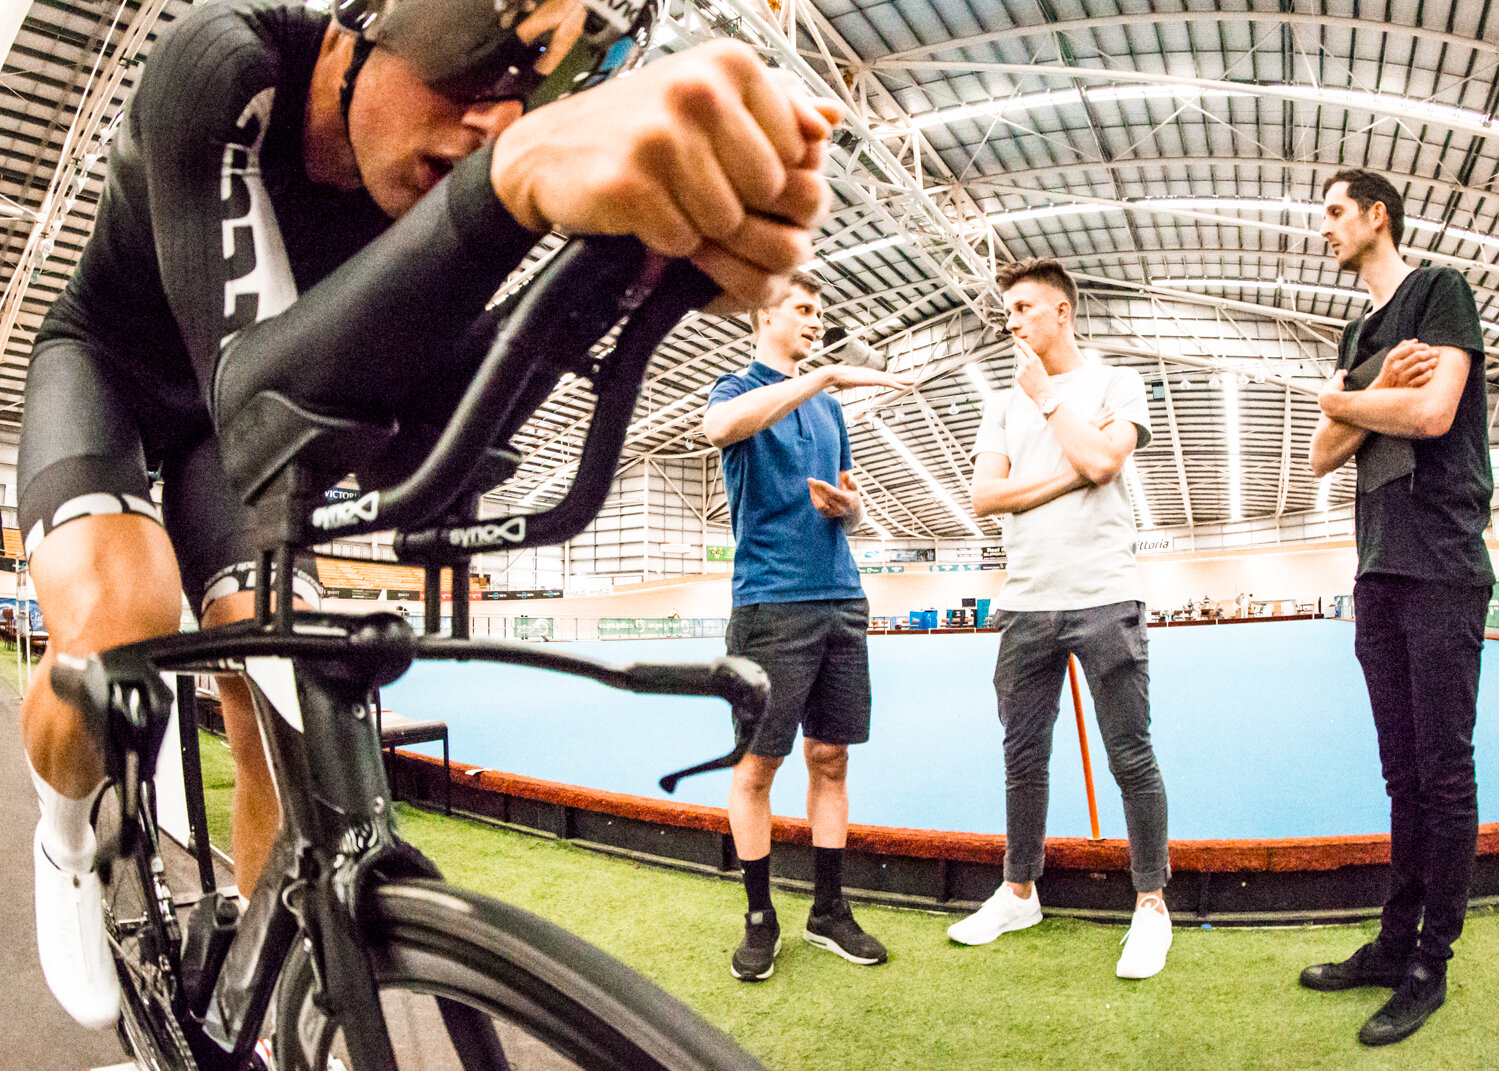
Field-based aerodynamic testing involves an athlete performing a number of laps around a velodrome, collecting upwards of 200 seconds of ride data, to be included in the analysed in a single run. This process is repeated, until enough data has been collected for the analysis of a single variable (evaluated in the consistency between runs). This process if further repeated, for comparison between test variables . Specific software (Alphamantis Technologies Track Aero System) is used to collect, track and record the live data stream. Power and speed are collected from the bike, air density is closely monitored and the Track Aero System (TAS) automatically quantifies aero performance. Post processing of the TAS data is performed using a bespoke software package, developed (achieve) specifically for the analysis of field aero testing data.
While aero testing with many athletes has allowed us to get to the point we are at now, there are a handful of athletes we routinely use for aero testing our products. These athletes are capable of performing consistent test runs, riding to a pre-determined power output/cadence/speed and have an accurate power meter on their bike. We use control wheels, tyres and skinsuits for testing to ensure that the conclusions we draw are accurate and reflect the changes made between test variables.
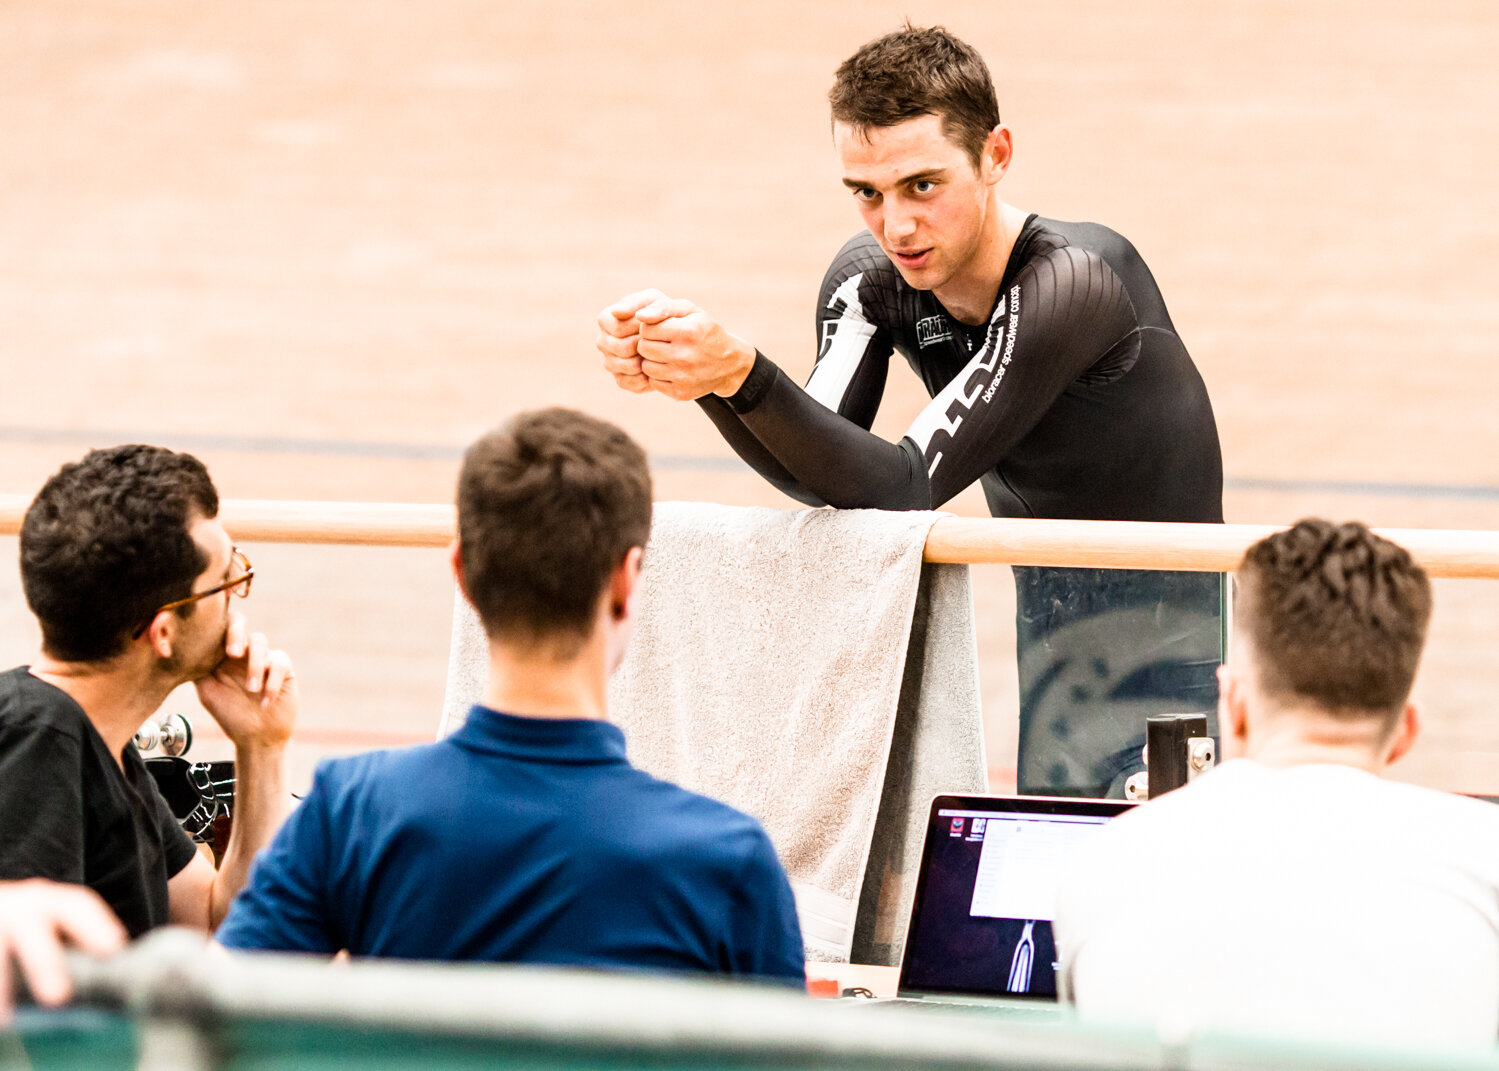
The test subject that we introduce for this testing session is Jordy Villani, unequivocally the most tested athlete we work with (over 100 test runs, over 1200 laps (300 km)). Jordy is fitting for this test, not only because of his ability to perform consistently, but also because Jordy has ridden literally every prototype we have tested along the Project 0.2 journey.
The Variables
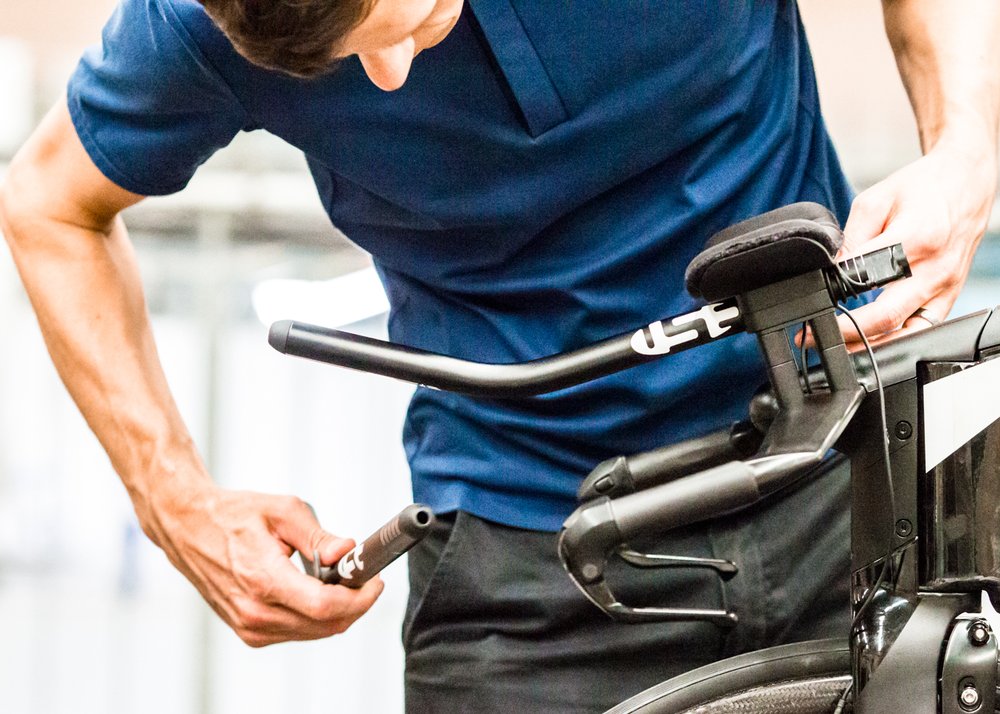
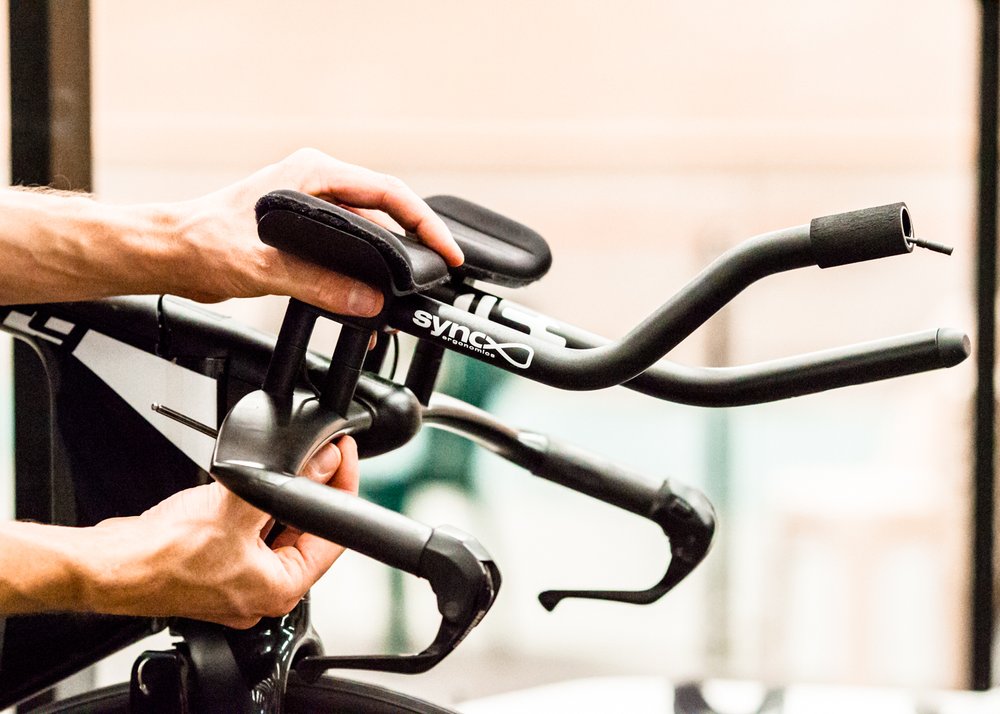
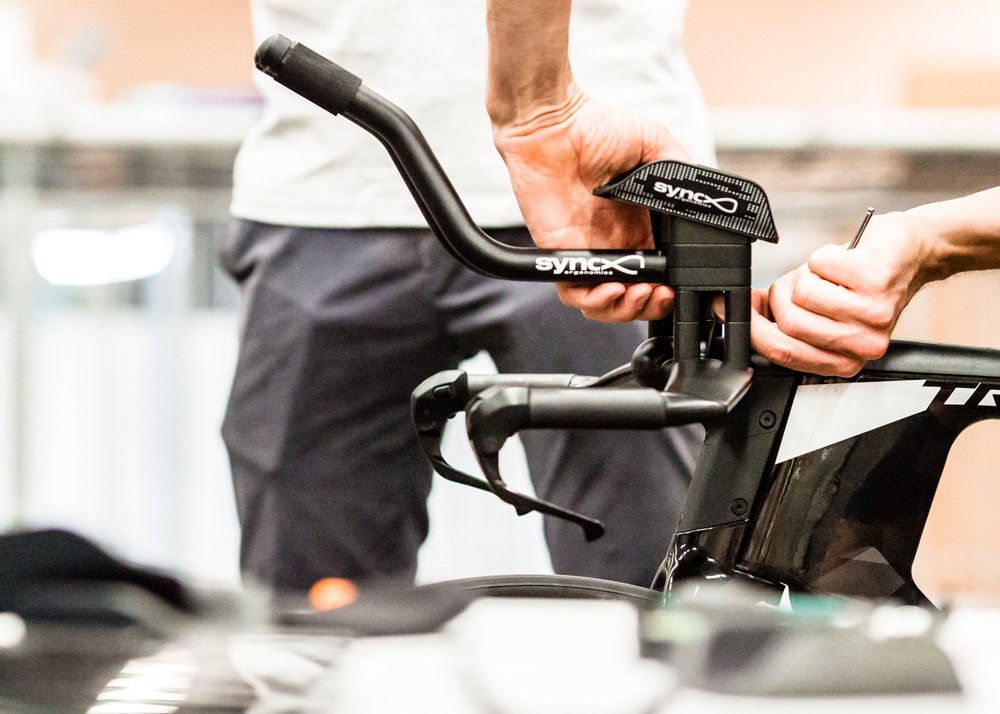
Variable 1 – Traditional low-rise ski bend extensions (30 degrees), promoting a flat forearm position, using the standard flat arm cups. This is the standard setup that many of us are familiar with.
Variable 2 – The complete UCI compliant Project 0.2 ecosystem, comprising our High Rise 3D extensions, 15-degree asymmetrical Arm Cup Wedges and our Deep Groove arm cups. This equipment change sees 100 mm of height gain (required for the high-hands position), supported by a 15-degree arm cup angle.
The test subject that we introduce for this testing session is Jordy Villani, unequivocally the most tested athlete we work with (over 100 test runs, over 1200 laps (300 km)). Jordy is fitting for this test, not only because of his ability to perform consistently, but also because Jordy has ridden literally every prototype we have tested along the Project 0.2 journey.
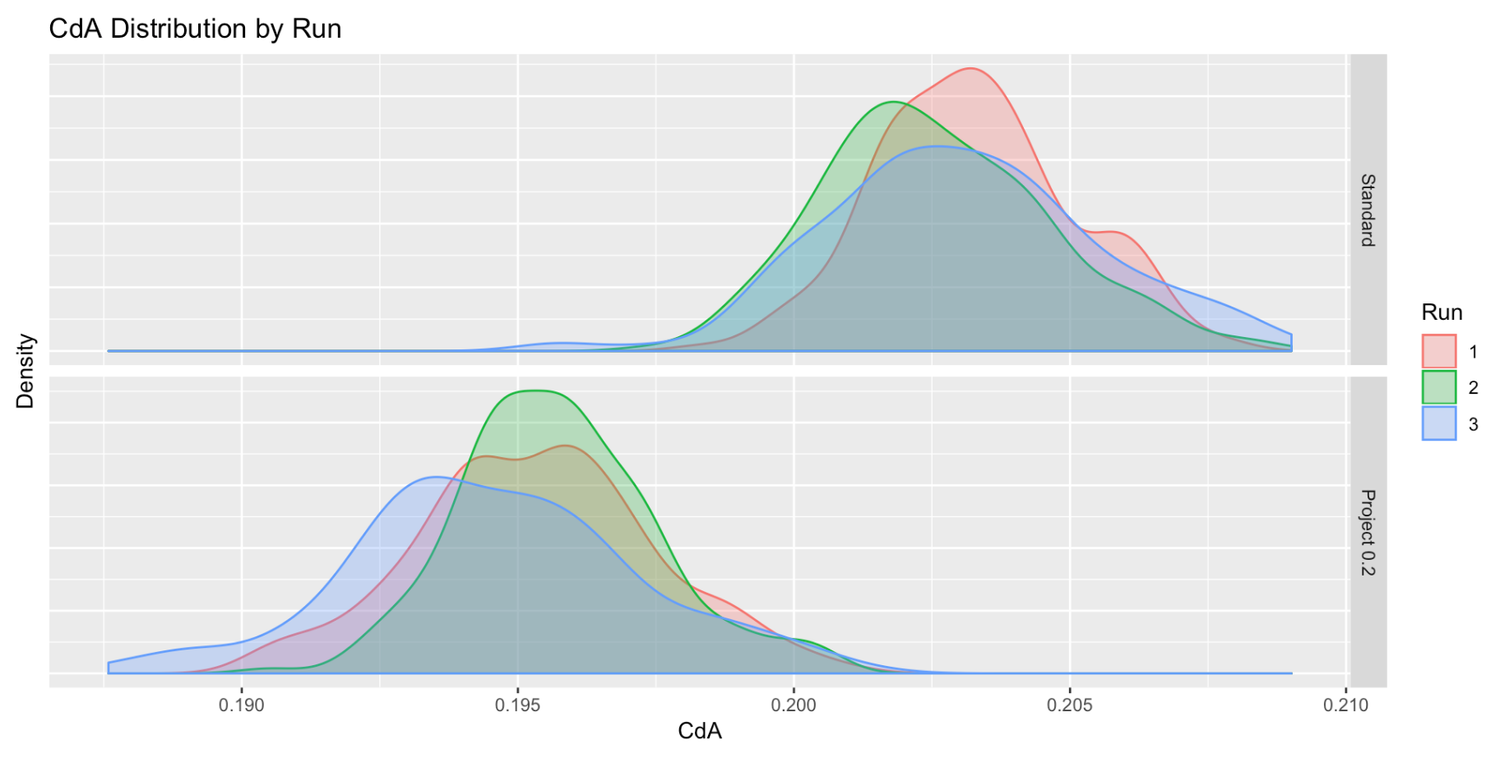
The Results - CdA Distribution
Visually, the the improvement in aerodynamic efficiency is easily summarised in the CdA distribution data, collected for each run, with each variable. The density of CdA distribution shows where the CdA measurement spent its time during each run. CdA is displayed on the X axis. The density (frequency at which the CdA was measured at any given value) is shown on the Y axis. Variables are split vertically and runs are colored by number. The same analysis method is used check the normality of the CdA data included for analysis (click through below).
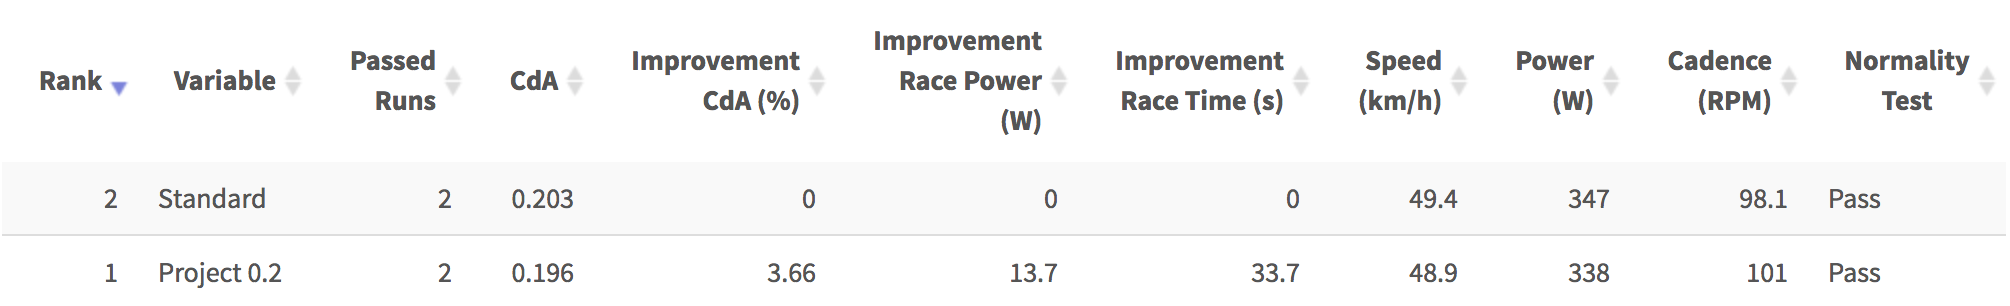
The Results - Improvements
The change to the Project 0.2 ecosystem provided Jordy with a 3.7% saving in aerodynamic drag, compared to the traditional low-rise/flat forearm setup (Standard). At 375 Watts, this is an equivalent power gain of 14 Watts and a time saving of 34 seconds over 40 km. For a half distance IRONMAN (at 275 Watts), this equates to an equivalent power gain of 10 Watts and a time saving of 168 seconds.
Improved Aerodynamic Efficiency
The Project 0.2 ecosystem improves aerodynamic performance through improving the quality of an athletes position. It achieves this by consideration to the role that each component plays and the design features required to perfectly execute the high-hands time trial position. These results are consistent with all of our baseline testing and testing we perform with other athletes at Adaptive Human Performance.
Since this testing session provided us with the opportunity to go back and test where Project 0.2 all began, we asked Jordy to comment on his experiences and where he feels the advantages are made.
“The Project 0.2 ecosystem offers a big improvement in my ability to hold an aero position, enabling me to more effectively shrug and tuck, without compromise to control or comfort. It’s a highly advanced ergonomic solution that noticeably improves my time trial performance. ”
Special Thanks
The data analysis processes would not have been possible without the help of Scott Gigante, creator of the custom data analysis package we use.
Special Thanks
Lukes. R.A, Chin. S.B & Haake, S.J 2005, The Understanding and Development of Cycling Aerodynamics,
International Journal of Sports Engineering, vol. 8, pp. 59-74. Retrieved from:
https://link.springer.com/article/10.1007/BF02844004
Special Thanks
All images are by Aaron Upson (@aaronupson)
The featured athlete is Jordy Villani (Subaru-AnchorPoint Cycling)
Words by Ken Ballhause of Sync Ergonomics